Thank you! Your submission has been received!
Oops! Something went wrong while submitting the form.
"PiinPoint has become an integral part of my role as Retail Analyst at Cushman & Wakefield Waterloo Region. The platform allows me to put together professional looking reports and provide clients with the insights they need to make real estate decisions.
I honestly don’t know how I would do my job effectively without PiinPoint."
Jessica McCabe, M.Ed.
Retail Analyst


PiinPoint’s Location Intelligence platform uses Mobile Location Data (MLD) to help you learn more about visitors to any location, including when they visited, their demographic profile and the distance they travelled to your location. This paper offers an overview on PiinPoint’s geofencing and Visitor Reports product, digging into the methodology used to predict visit patterns and covering the most valuable insights they provide.
We have partnered with Near, a leading provider of anonymized MLD, to draw insights from over 45 million mobile devices across North America each month.
Piinpoint receives vast amounts of raw observation data on a daily basis through our partnership with Veraset. With monthly tables representing hundreds of TBs of data, this represents a significant sample of data that can be used for a myriad of purposes. PiinPoint applies MLD to our Location Intelligence platform through three primary channels:


One of the most compelling applications of MLD is using it to observe the characteristics and behaviours of visitors at a specific location. In our app, we offer the ability to draw geofences and pull Visitor Reports on most* major properties or pieces of real estate in Canada.

Visitor Reports provide important insights for:
TRADE AREA CAPTURE RATE
Identifying where a visitor comes from, how far they've travelled, and the origin of their location.
TRADE AREA PROFILE DEVELOPMENT
Understand the demographic characteristics of visitors (based on clusters of visitors) such as income, education, age, and geosocial segmentation.
PREDICTIVE MODELLING
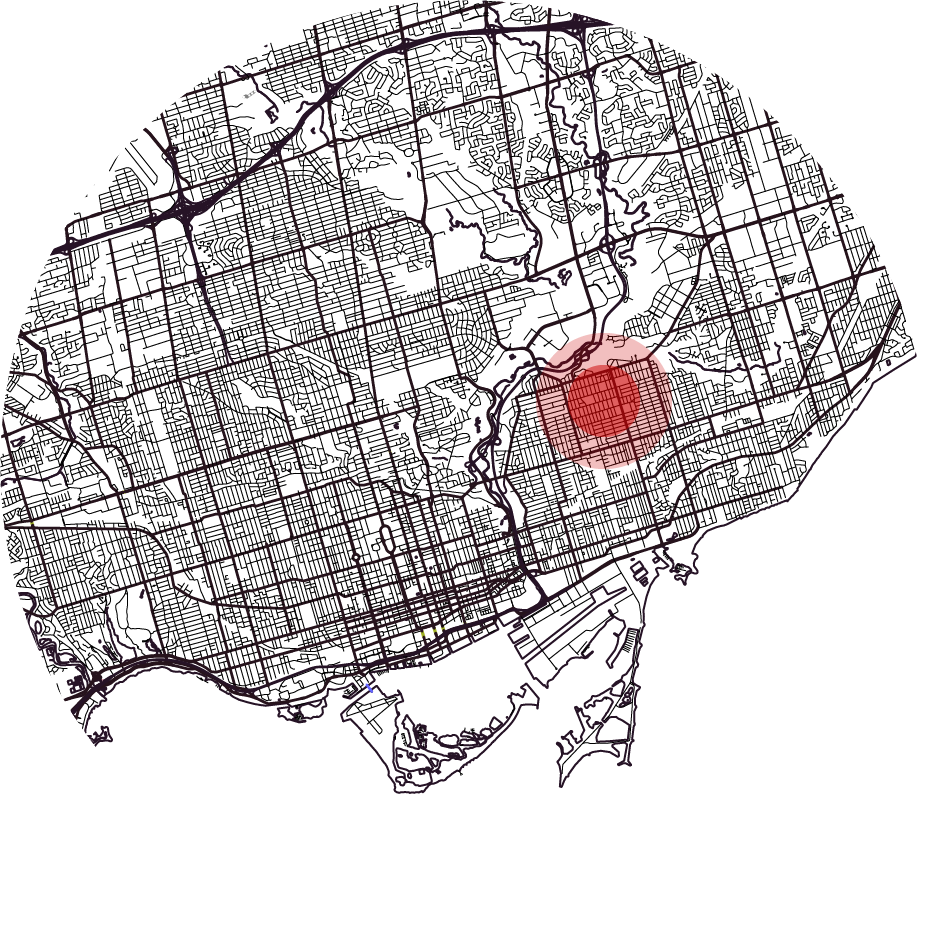
MLD can be used to help to predict performance by looking at mobile data activity volumes within a given area around current and existing sites, removing the activity directly at the existing sites (200 m buffer minus 30 m buffer, depending on footprint size).
Or, understand the shared traffic percentage by detecting the percentage of people driving by an event location (new potential site) and target location (existing site with the potential to be cannibalized).
COMPARATIVE ACTIVITY & TRENDS OVERTIME
Identify what areas are seeing more activity than others. How do these trends change over time?


Want to learn how MLD can grow your location intelligence strategy?
Contact us