Thank you! Your submission has been received!
Oops! Something went wrong while submitting the form.
"PiinPoint has become an integral part of my role as Retail Analyst at Cushman & Wakefield Waterloo Region. The platform allows me to put together professional looking reports and provide clients with the insights they need to make real estate decisions.
I honestly don’t know how I would do my job effectively without PiinPoint."
Jessica McCabe, M.Ed.
Retail Analyst
Build unlimited trade area reports to facilitate your site selection process
The starter plan provides a powerful location intelligence application for quickly evaluating your markets of interest. Build trade areas and visualize the demographic, points of interest and socioeconomic data related to them. Bring these insights into customizable single site reports that you can share with stakeholders. Support your network decisions with data-driven facts.
Create a report summarizing your selected demographic and Point of Interest variables for any trade area you’re interested in. Share this interactive report with your broker, team members or business partners to share your analysis and get quick buy-in.
Examine and portray demographic data visually, allowing you to precisely determine the locations of your customer base. Utilize this insight to predict customer and community growth with accuracy.
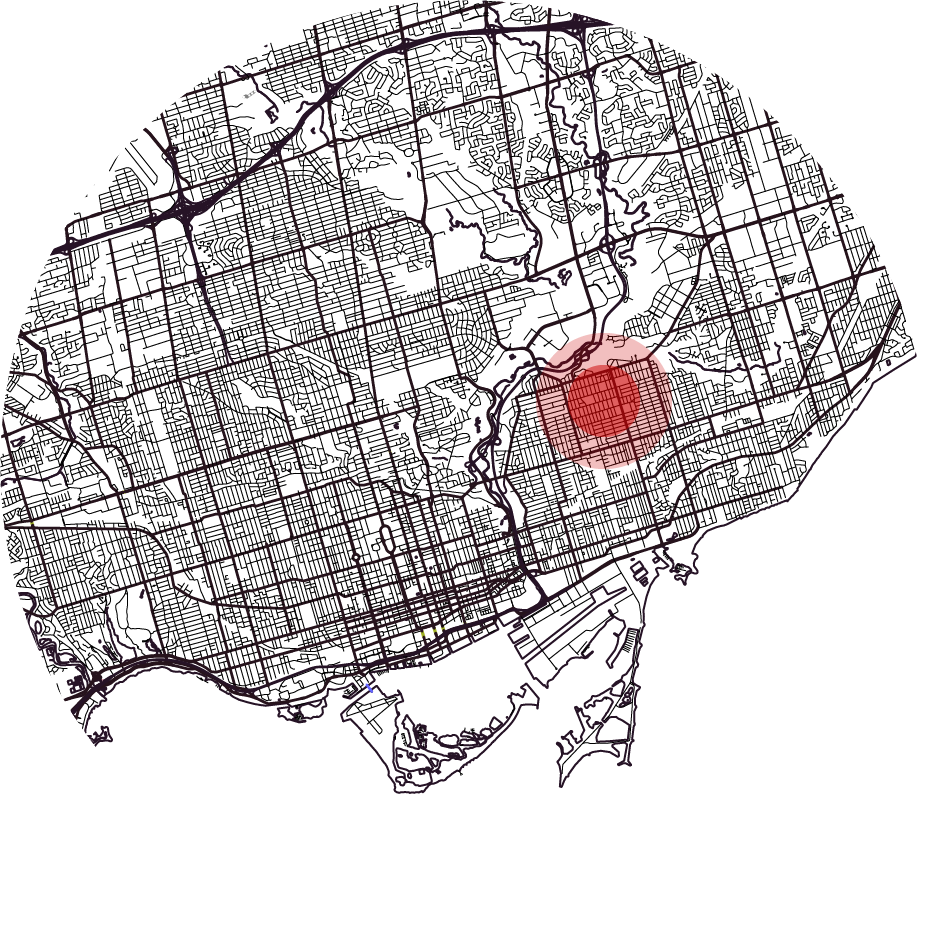
Plot the trade area around your location; using drive-times, walk-times, radius or custom drawn polygons.
Assess the existing retail landscape around potential sites using our built-in Points of Interest which cover all major retail chains in North America. This list is updated every 90 days so that you can stay on top of market shifts.
Geosocial data allows you to understand the interests, attitudes and mindsets of the people in a community. Insights are gathered from social media channels and sentiments from that data are organized in to 72 key geo segmentations that you can access as a heatmap to visualize customer groupings.
Traffic counts are counts of vehicular and pedestrian traffic, which is conducted along a particular road, path, or intersection. These metrics help to provide key information regarding the flow of traffic to, from, and nearby to a subject site. Vehicle Traffic application allows you to look at AADT (average annual daily traffic) for any major road segment in Canada.
Geofencing is perhaps the most exciting feature of our new Mobile Location Data toolset. It allows you to draw a custom polygon around the footprint of any building to capture visits for a given time range.
Sitematch Portals seamlessly collects and organizes properties shared with you by real estate partners. Properties are then loaded directly to PiinPoint to be evaluated using your location analytics framework, saving you hundreds of hours in listing management.
Explore Sitematch >